
Use a digital statistic to answer the question it actually measures. Australian business counts can describe the market. A business survey can describe reported technology use. A shopper survey or search study can describe the people and visits it observed. Each needs its own date and population.
This resource brings useful website, search and AI evidence together for Australian small-business owners. Keep the population beside the percentage when you use a figure in a plan, presentation or article. The reference periods below are the dates the data describes, even when the report was published later.
Australian Web Experts compiled this resource from the named sources. The statistics are their publishers' findings. The owner worksheet and explanatory diagram are AWE resources; they contain no original survey results or measured performance claims. Sources checked: 1 October 2026.
Download the traceable statistics ledger, use the owner-check worksheet, or read how we selected and checked the evidence. The ledger contains seven usable source records. Selected studies with narrower uses appear below with their qualifications.
How Many Australian Small Businesses Are There?
ABS counted 2,814,778 actively trading businesses in Australia's market sector at 30 June 2026. This is an administrative business count within the ABS scope, not a count of every ABN or individual business premises. The release was published on 18 August 2026. Source: ABS business counts, Table 13, with its scope and methodology.
Within that same count and reference date, 2,741,087 businesses had fewer than 20 employees, including non-employing businesses. ASBFEO's population summary curates the ABS figures. The underlying count is the sum of the non-employing, 1–4 and 5–19 employee categories in Table 13. ASBFEO's page does not display its own publication date; the underlying ABS release date is above.
That gives useful market context. It does not show how many firms need a new website, want SEO, or would buy either service. Those questions require different evidence.
What Do the Website and Social-Media Figures Cover?
The following estimates describe employing businesses within the ABS Business Characteristics Survey scope, during the year ended 30 June 2025. ABS published them on 25 June 2026. Its micro category is 0–4 persons employed; its small category is 5–19. The micro label does not extend this employing-business survey to every non-employing firm.
| Survey Category | Reported Own Website or App | What the Figure Measures |
|---|---|---|
| All employing businesses in scope | 55.1% | Businesses in the whole survey population reporting their own website or app |
| Employing micro businesses, 0–4 persons employed | 44.6% | Businesses in that size category reporting their own website or app |
| Small businesses, 5–19 persons employed | 68.7% | Businesses in that size category reporting their own website or app |
Source: ABS internet connectivity and activities, Table 3, cells B6, B8 and B9. The measure is “website or app”. It cannot establish a website-only rate for all Australian small businesses. The estimates have survey error; the source checks did not establish cell-specific error values for these figures.
In the same survey scope and reference year, 50.9% reported social-media online presence. That denominator is all employing businesses in scope, not only businesses with websites. The source is Table 3, cell C6, released 25 June 2026. Businesses could report multiple types of online presence, so website/app and social-media shares overlap. Do not add them together or describe the social-media figure as the share relying only on social media.
The ABS survey methodology describes an approximately 7,000-business stratified sample and an 87.9% response rate for the whole survey. Those are not the respondent counts behind each table cell. The survey excludes specified industries and types of entity as well as non-employing businesses.
A business count and a survey percentage are different inputs. Multiplying these website/app percentages by the national small-business count would mix populations and reference dates.
For your own website decision, start with the customer task: what must someone find out before they contact you? The Australian Government's website planning guide recommends setting website goals and considering the wider business plan. The owner worksheet below gives you a short evidence check without requiring a national benchmark.
What Does the ABS AI Figure Measure?
For 2024–25, ABS estimated that 12.1% of employing businesses in its survey scope reported using AI. The corresponding estimates were 10.7% for employing micro businesses (0–4 persons employed) and 12.3% for businesses with 5–19 persons employed. Each percentage uses all businesses in its own survey category as the denominator. These figures were released 25 June 2026 and describe the year ended 30 June 2025. Source: ABS use of ICT, Table 2, cells L7, L9 and L10. These are survey estimates with sampling and reporting error; cell-specific uncertainty was not established from the materials checked.
The survey asks about technology use. It does not measure how heavily a firm used AI, whether implementation succeeded, or whether it improved profit. It also does not measure customers searching with AI or a business appearing in an AI answer. Keep those questions separate.
Why Can AI Adoption Reports Give Different Answers?
The National AI Centre's tracker uses a different survey. Its published methodology describes 400 completed SME surveys per month, conducted by Fifth Quadrant, with responses weighted by industry, location and employee count. Surveys have run since May 2024; the businesses responding may change over time. The methodology page has no publication date displayed, and was checked on 1 October 2026.
Respondents are Australian SME owners or decision-makers, with size bands extending to 200–500 employees. The survey separates broad current use, limited current use, implementation and future intention. The monthly completion count is a survey-method detail, not an adoption rate. A percentage from a selected period needs that period, response definition and weighted denominator attached.
When comparing reports, ask whether they measure using, implementing or intending to use AI. Check the employee bands and fieldwork dates too. Averaging incompatible percentages would give you a number without a clear meaning.
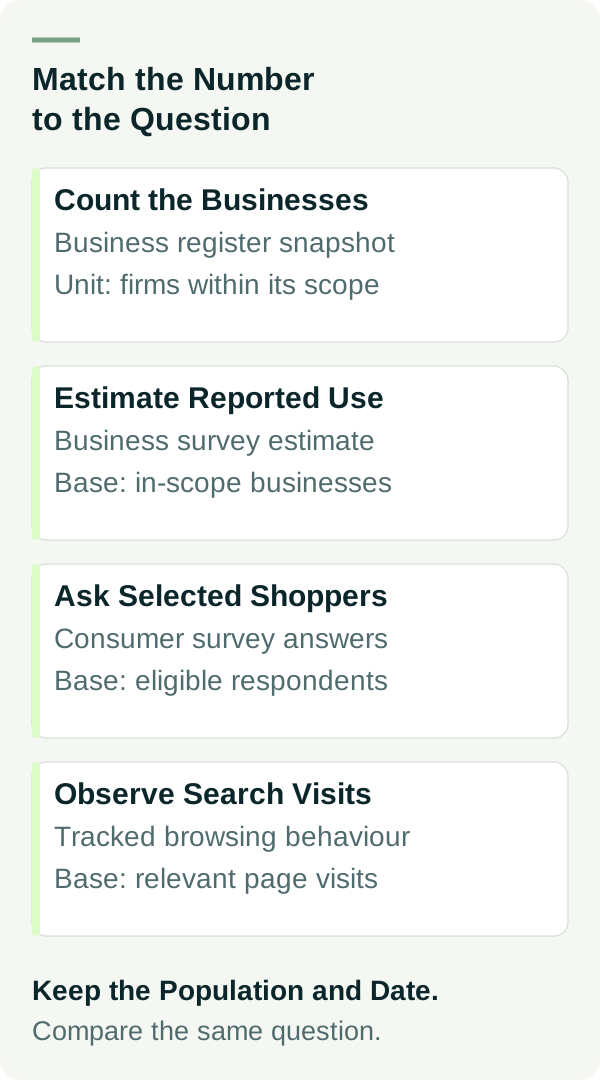
The diagram is an AWE explanation of the comparison task. It contains no measured results. The labels are repeated here so they remain readable without the image: count the business population; estimate reported business use; ask selected shoppers; observe tracked search visits. Match the source to the question you want to answer.
What Does the Australian AI-Shopping Survey Say?
Google reported that more than 70% of a commissioned Australian survey subset agreed AI Overviews and AI Mode helped them make faster and more confident decisions. The subset was 366 online shoppers aged 18+, who had made a consumer-goods purchase requiring consideration in the past week and used AI Overviews and/or AI Mode for shopping. The observation period was December 2025; the Google/Ipsos summary appeared in July 2026.
This is self-reported agreement among selected recent shoppers already using these tools. The summary does not supply the full questionnaire, response rate or weighting. It does not mean more than 70% of all Australians use AI search, or that the same share would choose a local trade business through it.
What Do Overseas Search and Platform Studies Tell Us?
These studies provide context for measurement. They are not Australian small-business benchmarks. Their populations, dates and outcomes differ from each other and from the business survey above.
US Search Visits With and Without AI Summaries
Pew's US browsing panel recorded traditional-result clicks on 8% of Google page visits with AI summaries, compared with 15% of visits without them. Links in the summaries were clicked on 1% of visits to pages with a summary. The denominator for each rate is the relevant group of visits, not all Australians or a site's position-one impressions.
The Pew study used browsing data from 900 US adults, covering March 2025, and a dataset of 68,879 unique Google searches. Results were reconstructed on 7–17 April 2025; the analysis was published 22 July 2025. Later result capture and next-visited-URL inference limit interpretation. This observational comparison does not establish the causal traffic loss of a particular Australian website.
Google's Aggregate Traffic Statement
On 6 August 2025, Google reported relatively stable year-on-year total organic click volume to websites. The statement concerns aggregate Search clicks; it does not disclose the underlying counts, exact comparison windows or a country breakdown. It is an attributed platform statement, not a reproducible forecast for your business.
A platform-wide total and a panel's click rate per page visit answer different questions. Either can sit alongside changes in the number or mix of searches. Neither gives you your own enquiry count.
Publisher Subscriptions From AI Referrals
Microsoft Clarity reported subscription CTR of 1.34% for LLM-referred traffic, compared with 0.55% for search, in a publisher/news-site study published 6 November 2025. Its public report references 1,277 analysed domains and smart-event conversion detection. It describes a one-month conversion window, but does not specify its exact dates, country mix or per-channel denominators.
These are subscription events within selected Clarity sites. They are not trade enquiries or paid jobs. The figures cannot support a promise that your AI traffic will convert at a particular multiple of search traffic.
What Should a Business Owner Check Next?
Use the figures as context, then write down the evidence you can collect for your own decision. These checks are AWE's practical recommendations, not findings from the studies.
| Your Decision | Useful Evidence | A Practical Next Step |
|---|---|---|
| Does the website explain what we do? | Current service wording, genuine coverage and unanswered customer questions | Record one unclear fact and give it an owner |
| Can a visitor find the enquiry route? | A visible contact link and its destination on the device you checked | Record the destination and any obstruction; avoid sending a test enquiry without a plan |
| Are search visits bringing the work we want? | A defined date window, relevant services, enquiries and their qualification/outcome | Compare like periods and keep unknown sources separate |
| Are we appearing in AI answers? | Exact prompts, dated answers, mentions and linked sources | Track visibility separately from visits and enquiries |
| Which statistic belongs in our plan? | Original source, population, period, denominator and limitations | Keep those labels attached when reusing the figure |
The downloadable owner worksheet gives you fields for the decision, evidence date, missing information, action owner and review. It asks you to record public page evidence or aggregate counts; leave passwords, customer details and private records out of it.
For repeated AI checks, use our AI visibility tracking guide. For Google eligibility, the AI Overviews guide covers the practical checks. Google's technical documentation, updated 10 December 2025 and checked 1 October 2026, says supporting pages need to be indexed and eligible for Search snippets; special AI schema is not required. This is operational guidance with no statistical denominator. Eligibility does not guarantee a citation or indexing.
A mention, a source link, a visit, an enquiry and a paid job are separate records. Keep the date, source and measurement definition with each one.
Download, Attribution and Corrections
The statistics ledger preserves each usable claim's source link, publication date, observation period, population, geography, denominator, method and limits. ASBFEO's count is labelled as official curation of ABS data. AWE's compilation is not an original survey.
The methodology note explains the selection and refresh process. Reuse figures with their original-source attribution and qualifications. If a source changes, use the updated reference period rather than relabelling an older observation as a new finding.
If you want help turning a website or search question into a practical plan, contact Australian Web Experts with the decision you are trying to make and a link to the relevant page.