

If Google search clicks increased but enquiries stayed flat, first check which searches grew, where those clicks landed and whether the enquiry record is comparable. More clicks can come from people looking for information, an existing customer searching your name or someone looking for a service you do not offer.
That does not mean the extra traffic is useless. It means the total alone cannot tell you whether more suitable potential customers reached the site. Check the evidence before blaming the homepage, changing the form or promising that another ranking improvement will fix it.
Use the query-mix review sheet to compare two periods and record what remains uncertain. Keep your original report export separate from the working classification sheet.
Make the Two Observations Comparable
Write down what “clicks” and “enquiries” mean in your report. Search Console clicks describe interactions with Google search results. A website contact event, a received message and an accepted enquiry are different observations. Confirm which one you are counting and how duplicates, spam and test messages are handled.
Choose completed periods with the same duration and sensible trading context. Record the Search Console property, search type, country, device and any query or page filters. Keep those settings consistent. Note reporting time bases and avoid comparing a finished month with a partial one.
For text query classification, choose Web: text-based. Google's report overview distinguishes this from Web: multimodal. The dimensions documentation says text query data is unavailable for multimodal searches, so review that traffic separately. Keep any separate AI performance report distinct too.
Check whether the enquiry process changed during either period. A new spam filter, missed inbox, different logging practice or changed form can alter the count without changing search demand. If the enquiry data is incomplete, record that gap before drawing a conclusion.
Group the Visible Queries by the Business Question
Use groups that help you make a decision. For a small service business, start with:
- Offered-service intent: someone appears to be seeking work the business actually accepts.
- Brand intent: someone searches for the business or a recognisable brand variation.
- Information intent: someone wants advice, a definition or instructions.
- Wrong service or area: the wording does not fit the confirmed offer or coverage.
- Uncertain: there is not enough information to classify it safely.
Classify ambiguous brand searches as brand first, then add a separate service-fit note if useful. Do not count the same row in two groups when adding totals. Keep the rules consistent across both periods.
A query can suggest intent, but it does not identify the person or prove their location, budget or readiness to buy. Confirm service fit with the owner. Use country filters as reporting settings, not evidence that every person is inside your service area.
Treat the Query Table as a Partial View
Google withholds anonymised queries and applies limits to query reporting. Chart totals and visible query totals can differ, and query filters affect what is included. The filtering guidance explains these limits.
Record the denominator used for any share. “Offered-service rows were 30% of the clicks in our classified export” is different from claiming they were 30% of all site search clicks. Keep chart totals, exported row totals, classified totals and unclassified rows separate.
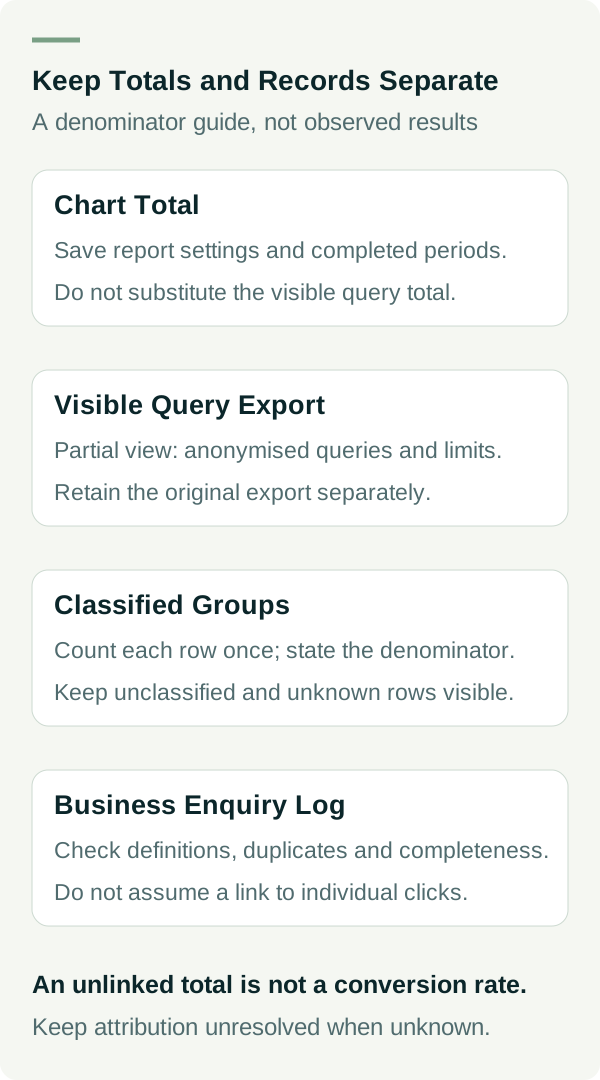
Do not add page-level rows back into the property total. If you inspect a query's Pages view, record that filtered evidence separately. Several URLs can appear under the same query; repeatedly summing them into your overall query groups can misrepresent the comparison.
Work Through a Small Worked Example
These numbers are invented to explain the decision. They are not client results, a benchmark or a complete representation of what Search Console reports.
| Group in the example classified extract | Earlier period clicks | Later period clicks |
|---|---|---|
| Offered-service intent | 20 | 18 |
| Brand intent | 10 | 12 |
| Information intent | 10 | 30 |
| Total in this illustration | 40 | 60 |
The total rises by 20 clicks, or 50%: (60 − 40) ÷ 40. Offered-service clicks fall by two. Their share of this example extract falls from 20 ÷ 40 = 50% to 18 ÷ 60 = 30%.
Suppose a separate business log records six accepted enquiries in each period. That does not establish a search conversion rate. The log is not linked to individual search clicks, and it may include other sources. It shows a flat business observation alongside a changed query mix, with attribution still unresolved.
The useful next step is to inspect the growing information queries and their destination pages, then check whether offered-service searches still reach a suitable page. The example does not prove that information traffic caused flat enquiries, that the form failed or that those visitors will never become customers.
The worked example CSV and calculation notes keep the arithmetic and limits explicit.
Choose a Check That Fits the Pattern
| Observation | Useful next check | Conclusion to avoid |
|---|---|---|
| Information queries account for most visible growth. | Read those pages and assess whether the next step fits their readers. | All additional traffic is poor quality. |
| Offered-service clicks fall despite a higher total. | Compare those queries and their observed pages under the same settings. | The whole campaign improved because total clicks rose. |
| Suitable search traffic appears stable, but logged enquiries fall. | Check controlled form delivery, contact routes and logging consistency. | The form is broken without a functional test. |
| Wrong-service or area queries grow. | Confirm the actual offer and inspect the relevant page wording. | Add a service or location the business cannot fulfil. |
| The export or enquiry record is incomplete. | Resolve the missing input or keep the decision on hold. | Fill gaps with estimates presented as observations. |
Google's traffic investigation guidance also points to changing demand and seasonality. Use that context when judging the comparison. A change in the mix may deserve investigation without justifying a wholesale rewrite.
If you are considering another search channel, compare the complete commitment before switching.
Record the Decision and the Next Observation
End the review with one specific check, a person responsible and a review point. Save the filters and evidence reference so the comparison can be repeated. If the check leads to a website change, record the change separately and verify it live before reviewing outcomes.
Keep private customer details and account identifiers out of the worksheet you share publicly. Use aggregate enquiry counts or internal evidence references. The template has no account connection and makes no attribution calculation.
Need help working out whether search growth matches the work your business wants? Talk to Matt about your search traffic and enquiry journey.